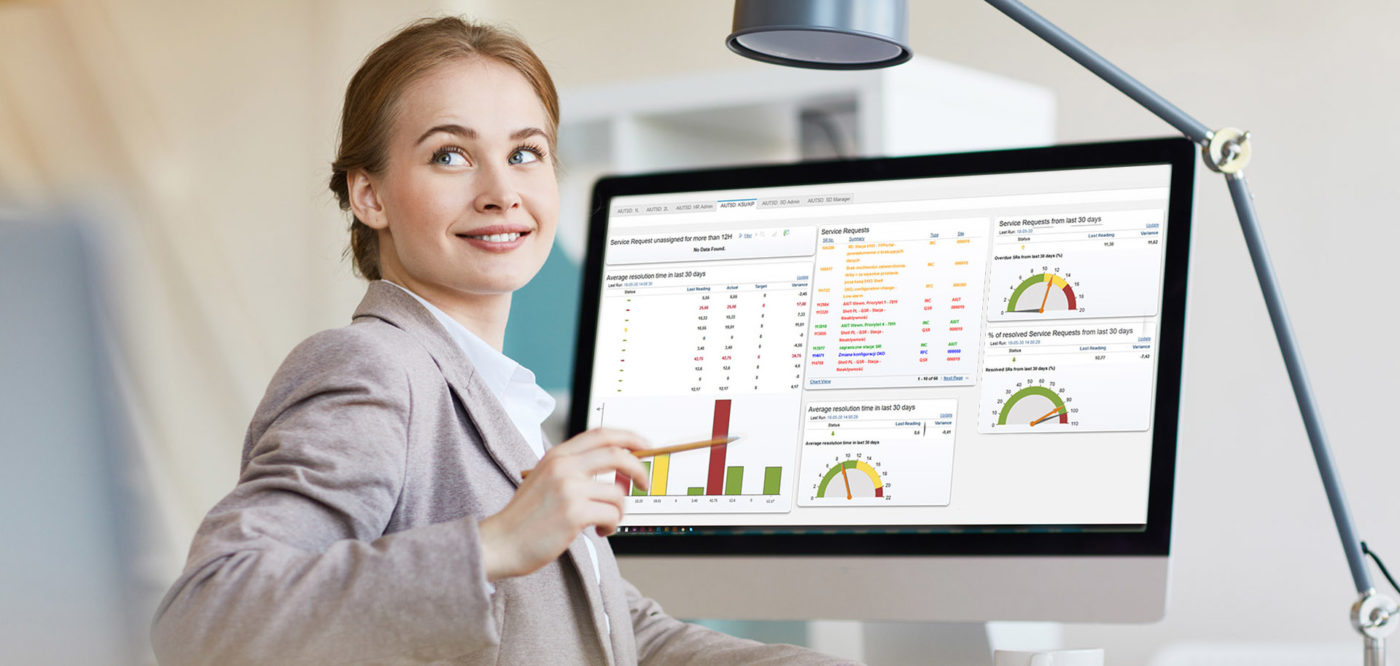
Create advanced analyses and business reports. Experience a self-service analysis solution, that will take your presentations to the next level.

IBM Cognos Analytics is a cloud-based intelligent data analysis solution that facilitates visualization, presentation and sharing of information about your business.
Work comfort with Cognos Analytics
New dimension of reports: use Artificial Intelligence (AI) to create advanced and readable reports and interactive control panels. Use geospatial functions to present data in the physical world thanks to overlay options.
We offer an advanced tool that creates legible and clear messages. Convert information hidden in data using a simple language, visual analysis and machine learning. View direct data comparisons for different scenarios.
Use the AI assistant to ask questions and receive clear answers in a friendly, simple form.
Interactive, animated data presentations are new tools in the hands of your team. Use the potential of modern solutions to develop your business. Use cloud options to easily share your work with others. Save, comment and share your visuals via email or Slack.
Schedule distribution and share reports with all interested parties. You like boring presentations? Neither do your recipients. Tell the story instead of just presenting charts. Combine visualizations, add layers, voice comments and interactive elements.
Use automation and intelligent analysis mechanisms to clean-up, combine and share data. Import data from spreadsheets, CSV files, the cloud and local databases. Automatically detect related data sources. Add new columns and calculations, divide, move and hide modules.
Control access to information through role-based supervision and single sign-on (SSO).
Who will find IBM Cognos useful?
A business user who wants to easily create spectacular visuals and cockpits. A manager who needs a proven, self-service analysis solution. A company, the activities of which require scalability and supervision of the analyses. IBMCognos®Analytics addresses all those needs in both local and cloud environments.
Explore the advantages of the system
- Use both built-in and new data models for your reporting and analyses.
- Create permanent and ad-hoc reports, depending on the needs and requirements of your business.
- Analyse data spatially and on multiple levels by using hollowcore and OLAP cube methods.
- Create and modify reports prepared by other users multiple times, according to own analysis criteria.
- Present your data in various forms - including graphically - and share them using common methods.
- Gain key information by using start centers and cockpits (dashboards).